Dreieck-Prozess
Question
Solution
Short
Video
\(\LaTeX\)
Need help? Yes, please!
The following quantities appear in the problem:
The following formulas must be used to solve the exercise:

No explanation / solution video to this exercise has yet been created.
Visit our YouTube-Channel to see solutions to other exercises.
Don't forget to subscribe to our channel, like the videos and leave comments!
Visit our YouTube-Channel to see solutions to other exercises.
Don't forget to subscribe to our channel, like the videos and leave comments!
Exercise:
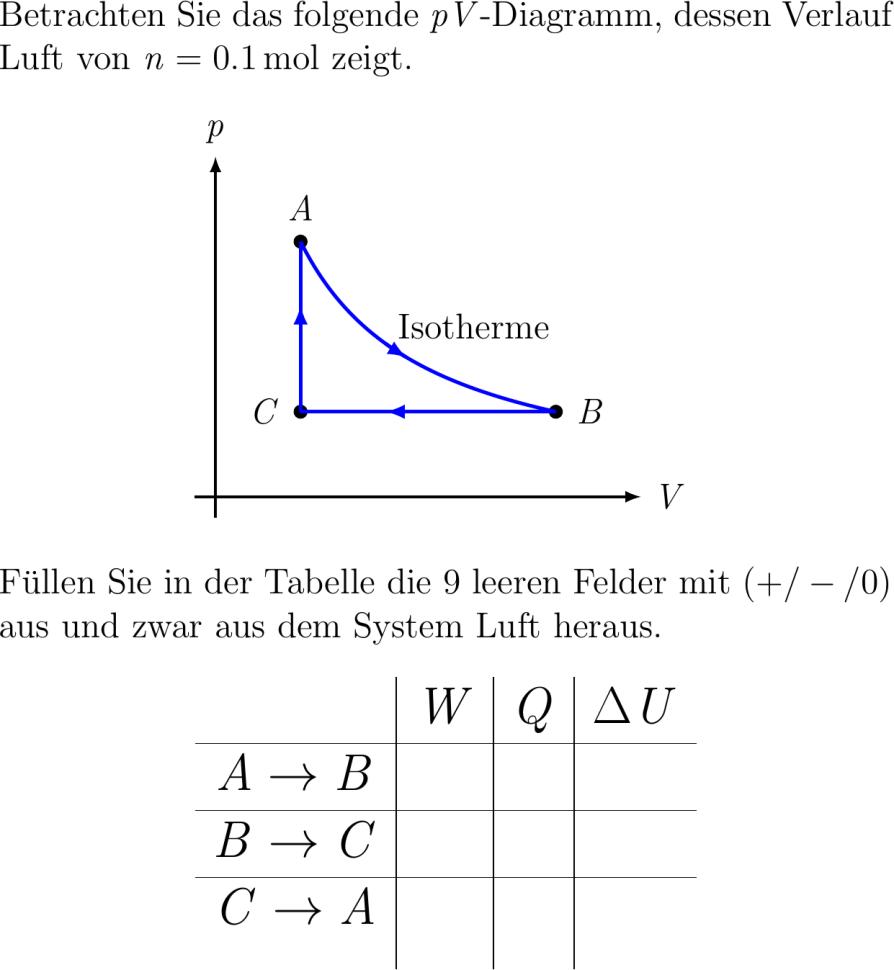
Betrachten Sie das folge pV-Diagramm dessen Verlauf Luft von n.mol zeigt. center tikzpicturescale. % Koordinaten draw thick-latex -. -- node right V; draw thick-latex -. -- node above p; % Punkte A draw fillblack node aboveyshiftmm A circle .mm; % Punkte B draw fillblack node rightxshiftmm B circle .mm; % Punkte C draw fillblack node leftxshift-mm C circle .mm; % Funktion draw domain:.very thick- blue plotidhyp samples x/x+; draw domain:very thick blue plotidhyp samples x/x+; node right at Isotherme; % Funktion draw very thick blu -- ; draw very thick blue . -- ; % Funktion draw very thick blu -- .; draw very thick blue . -- ; tikzpicture center Füllen Sie in der Tabelle die leeren Felder mit +/-/ aus und zwar aus dem System Luft heraus. center Large tabularc|c|c|c & W & Q & Delta U hline Arightarrow B && hline Brightarrow C&& hline Crightarrow A&&mm tabular Large center
Solution:
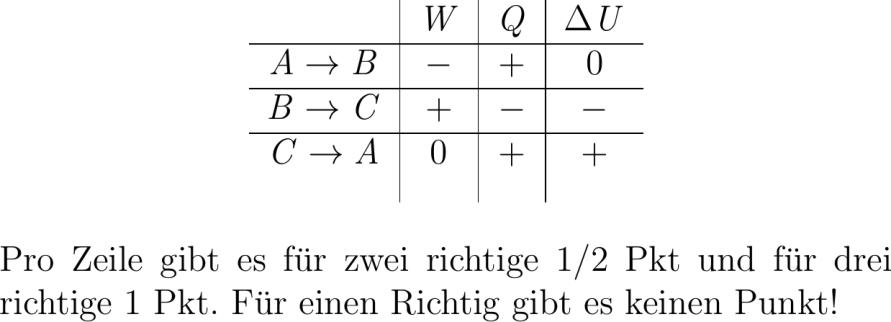
center % Large tabularc|c|c|c & W & Q & Delta U hline A rightarrow B &-&+& hline Brightarrow C&+&-&- hline Crightarrow A&&+&+mm tabular % Large center Pro Zeile gibt es für zwei richtige / Pkt und für drei richtige Pkt. Für einen Richtig gibt es keinen Punkt!
Betrachten Sie das folge pV-Diagramm dessen Verlauf Luft von n.mol zeigt. center tikzpicturescale. % Koordinaten draw thick-latex -. -- node right V; draw thick-latex -. -- node above p; % Punkte A draw fillblack node aboveyshiftmm A circle .mm; % Punkte B draw fillblack node rightxshiftmm B circle .mm; % Punkte C draw fillblack node leftxshift-mm C circle .mm; % Funktion draw domain:.very thick- blue plotidhyp samples x/x+; draw domain:very thick blue plotidhyp samples x/x+; node right at Isotherme; % Funktion draw very thick blu -- ; draw very thick blue . -- ; % Funktion draw very thick blu -- .; draw very thick blue . -- ; tikzpicture center Füllen Sie in der Tabelle die leeren Felder mit +/-/ aus und zwar aus dem System Luft heraus. center Large tabularc|c|c|c & W & Q & Delta U hline Arightarrow B && hline Brightarrow C&& hline Crightarrow A&&mm tabular Large center
Solution:
center % Large tabularc|c|c|c & W & Q & Delta U hline A rightarrow B &-&+& hline Brightarrow C&+&-&- hline Crightarrow A&&+&+mm tabular % Large center Pro Zeile gibt es für zwei richtige / Pkt und für drei richtige Pkt. Für einen Richtig gibt es keinen Punkt!