Wertetabelle und Graph einer linearen Funktion
Question
Solution
Short
Video
\(\LaTeX\)

No explanation / solution video to this exercise has yet been created.
Visit our YouTube-Channel to see solutions to other exercises.
Don't forget to subscribe to our channel, like the videos and leave comments!
Visit our YouTube-Channel to see solutions to other exercises.
Don't forget to subscribe to our channel, like the videos and leave comments!
Exercise:
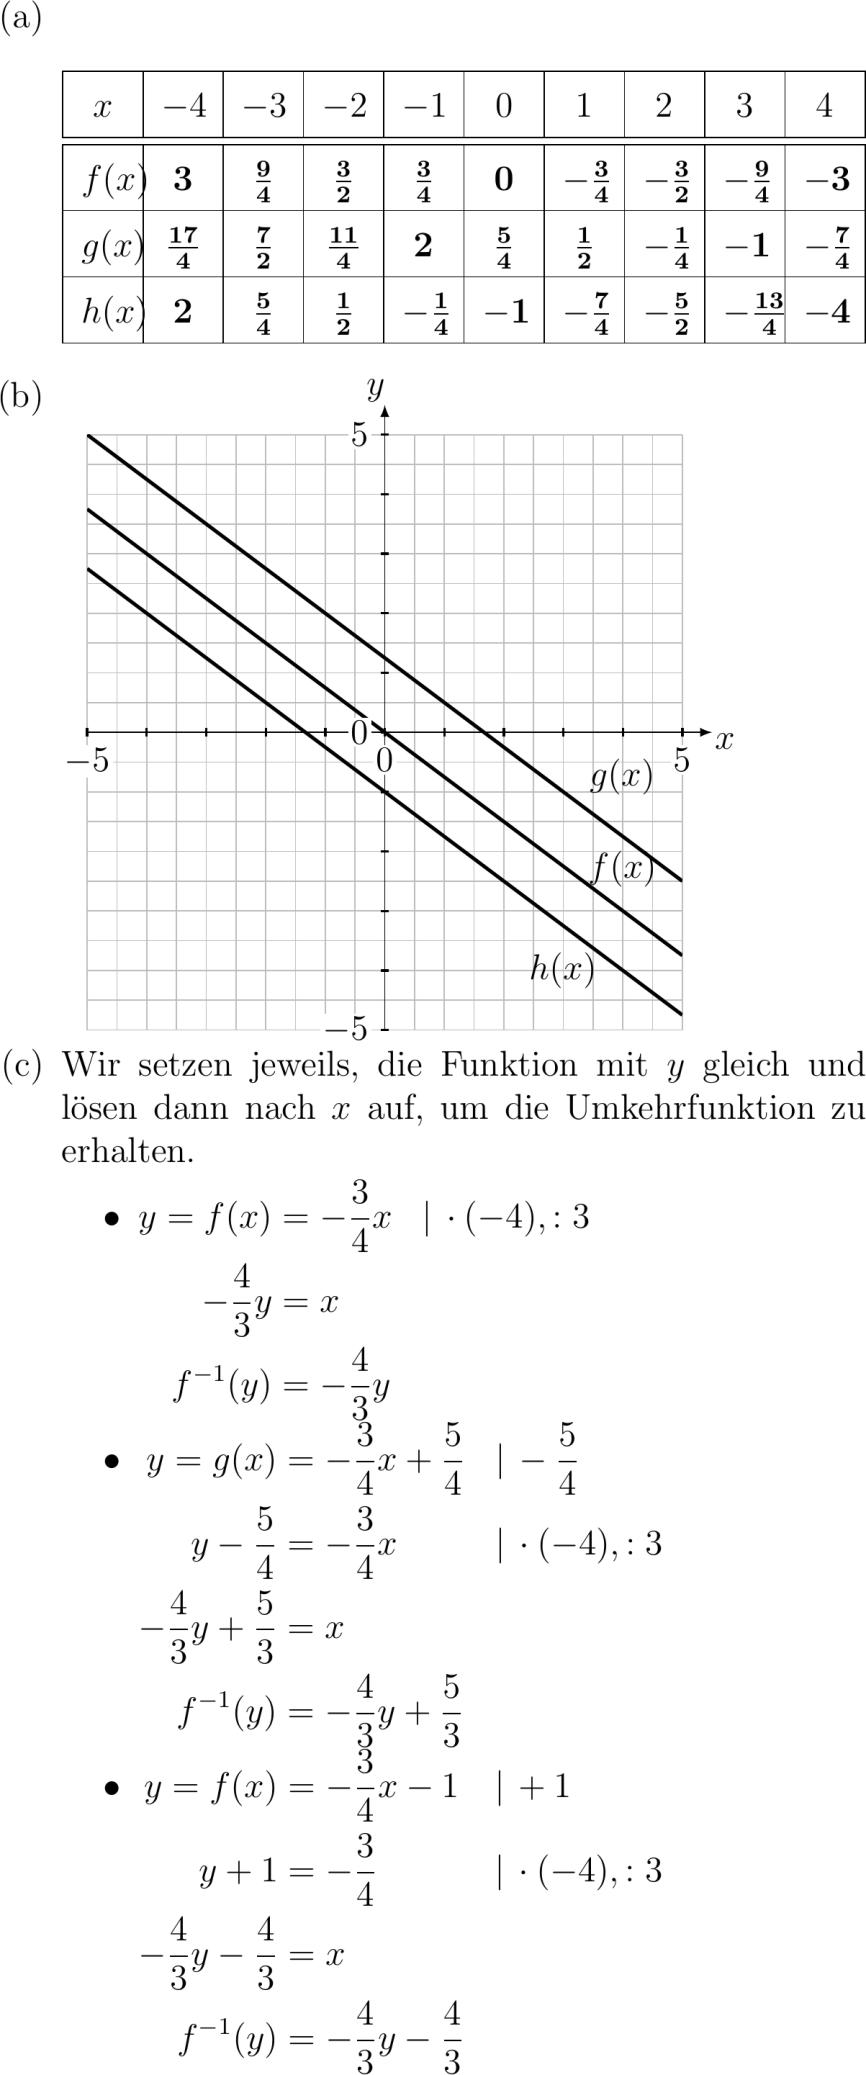
Gegeben sind die linearen Funktionen fx -fracx quad gx -frac x + frac quad hx -frac x -. abclist abc Vervollständige die folge Wertetabelle. center renewcommandarraystretch. tabularx.textwidth|Y|Y|Y|Y|Y|Y|Y|Y|Y|Y| hline x & - & - & - & - & & & & & hline hline fx & & & & & & & & & hline gx & & & & & & & & & hline hx & & & & & & & & & hline tabularx center abc Zeichne die Graphen dieser Funktionen in das Koordinatensystem unten links. abc Bestimme die Umkehrfunktionen dieser Funktionen. abclist
Solution:
abclist abc phantom. center renewcommandarraystretch. adjustboxvttabularx.textwidth|Y|Y|Y|Y|Y|Y|Y|Y|Y|Y| hline x & - & - & - & - & & & & & hline hline fx & bf & bf frac & bf frac & bf frac & bf & bf -frac& bf -frac & bf -frac & bf - hline gx & bf frac& bf frac& bf frac& bf & bffrac &bffrac &bf -frac &bf - &bf -frac hline hx & bf & bf frac & bffrac & bf -frac & bf - & bf -frac &bf -frac & bf-frac &bf - hline tabularx center abc adjustboxvttikzpicturescale. tkzInitxmin-xmaxymin-ymax tkzGridstep. tkzDrawXright tkzDrawYabove tkzFctvery thickdomain-:-.*x tkzText-.gx tkzFctvery thickdomain-:-.*x+. tkzText-.fx tkzFctvery thickdomain-:-.*x- tkzText-hx tkzLabelXYstep tikzpicture abc Wir setzen jeweils die Funktion mit y gleich und lösen dann nach x auf um die Umkehrfunktion zu erhalten. nprvmulticols itemize item edt y fx -frac x uf -: -fracy x f^-y -fracy ed item edt y gx -frac x + frac uf -frac y - frac -fracx uf -: -fracy + frac x f^-y -fracy + frac ed item edt y fx -frac x - uf + y + -frac uf -: -fracy - frac x f^-y -fracy - frac ed itemize nprvmulticols abclist