Überlegung zu einem s-t-Diagramm
Question
Solution
Short
Video
\(\LaTeX\)
Need help? Yes, please!
The following quantities appear in the problem:
The following formulas must be used to solve the exercise:
No explanation / solution video to this exercise has yet been created.
Visit our YouTube-Channel to see solutions to other exercises.
Don't forget to subscribe to our channel, like the videos and leave comments!
Visit our YouTube-Channel to see solutions to other exercises.
Don't forget to subscribe to our channel, like the videos and leave comments!
Exercise:
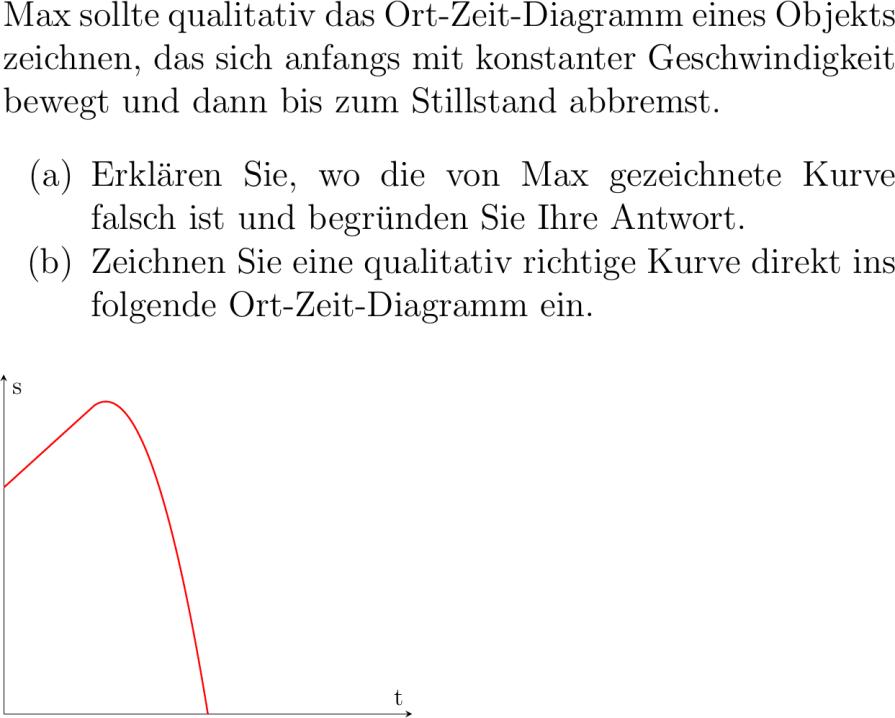
Max sollte qualitativ das Ort-Zeit-Diagramm eines Objekts zeichnen das sich anfangs mit konstanter Geschwindigkeit bewegt und dann bis zum Stillstand abbremst. abcliste abc Erklären Sie wo die von Max gezeichnete Kurve falsch ist und begründen Sie Ihre Antwort. abc Zeichnen Sie eine qualitativ richtige Kurve direkt ins folge Ort-Zeit-Diagramm ein. abcliste medskip adjustboxheightcm tikzpicture axis axis linesmiddle xmin xmax ymin ymax. %grid xlabeltxlabel stylealiasaux ylabelsylabel stylealiasauy xmajorticksfalse ymajorticksfalse %xtick %ytick----. addplotdomain:samplessmooththickred .*x+.; addplotdomain:samplessmooththickred -.*x-*x-; axis tikzpicture adjustbox
Solution:
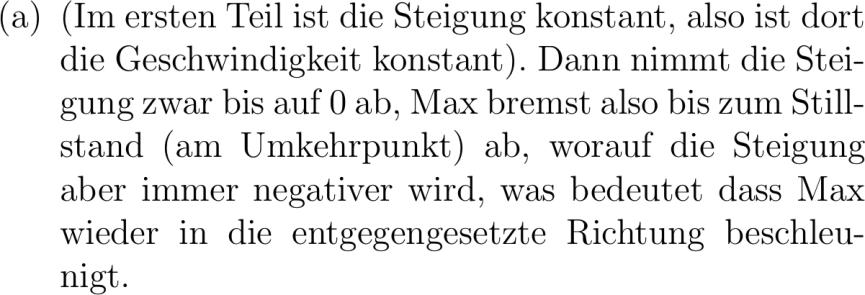
abcliste abc Im ersten Teil ist die Steigung konstant also ist dort die Geschwindigkeit konstant. Dann nimmt die Steigung zwar bis auf ab Max bremst also bis zum Stillstand am Umkehrpunkt ab worauf die Steigung aber immer negativer wird was bedeutet dass Max wieder in die entgegengesetzte Richtung beschleunigt. %abc Unterhalb der t-Achse sind sowohl die Beschleunigung negative Steigung als auch die Geschwindigkeit negativ womit das Objekt wieder schneller wird. abcliste
Max sollte qualitativ das Ort-Zeit-Diagramm eines Objekts zeichnen das sich anfangs mit konstanter Geschwindigkeit bewegt und dann bis zum Stillstand abbremst. abcliste abc Erklären Sie wo die von Max gezeichnete Kurve falsch ist und begründen Sie Ihre Antwort. abc Zeichnen Sie eine qualitativ richtige Kurve direkt ins folge Ort-Zeit-Diagramm ein. abcliste medskip adjustboxheightcm tikzpicture axis axis linesmiddle xmin xmax ymin ymax. %grid xlabeltxlabel stylealiasaux ylabelsylabel stylealiasauy xmajorticksfalse ymajorticksfalse %xtick %ytick----. addplotdomain:samplessmooththickred .*x+.; addplotdomain:samplessmooththickred -.*x-*x-; axis tikzpicture adjustbox
Solution:
abcliste abc Im ersten Teil ist die Steigung konstant also ist dort die Geschwindigkeit konstant. Dann nimmt die Steigung zwar bis auf ab Max bremst also bis zum Stillstand am Umkehrpunkt ab worauf die Steigung aber immer negativer wird was bedeutet dass Max wieder in die entgegengesetzte Richtung beschleunigt. %abc Unterhalb der t-Achse sind sowohl die Beschleunigung negative Steigung als auch die Geschwindigkeit negativ womit das Objekt wieder schneller wird. abcliste